Significant Figures

1.6 Significant Figures
Learning Objectives
By the end of this section, you will be able to:
- Determine the correct number of significant figures for the result of a computation.
- Describe the relationship between the concepts of accuracy, precision, uncertainty, and discrepancy.
- Calculate the percent uncertainty of a measurement, given its value and its uncertainty.
- Determine the uncertainty of the result of a computation involving quantities with given uncertainties.
Accuracy and Precision of a Measurement
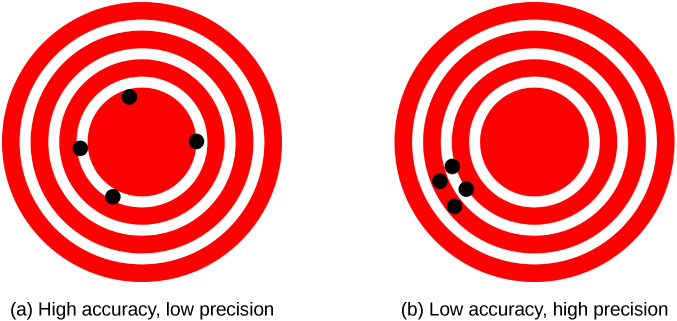
Accuracy is how close a measurement is to the accepted reference value for that measurement.
The precision of measurements refers to how close the agreement is between repeated independent measurements (which are repeated under the same conditions).
Uncertainty, and Discrepancy
The precision of a measuring system is related to the uncertainty in the measurements whereas the accuracy is related to the discrepancy from the accepted reference value. Uncertainty is a quantitative measure of how much your measured values deviate from one another.
Some factors that contribute to uncertainty in a measurement include the following:
- Limitations of the measuring device
- The skill of the person taking the measurement
- Irregularities in the object being measured
- Any other factors that affect the outcome (highly dependent on the situation)
Precision of Measuring Tools and Significant Figures
When we express measured values, we can only list as many digits as we measured initially with our measuring tool. For example, if we use a standard ruler to measure the length of a stick, we may measure it to be 36.7 cm. We can’t express this value as 36.71 cm because our measuring tool is not precise enough to measure a hundredth of a centimeter.
It should be noted that the last digit in a measured value has been estimated in some way by the person performing the measurement. For example, the person measuring the length of a stick with a ruler notices the stick length seems to be somewhere in between 36.6 cm and 36.7 cm, and he or she must estimate the value of the last digit.
Using the method of significant figures, the rule is that the last digit written down in a measurement is the first digit with some uncertainty. To determine the number of significant digits in a value, start with the first measured value at the left and count the number of digits through the last digit written on the right. For example, the measured value 36.7 cm has three digits, or three significant figures. Significant figures indicate the precision of the measuring tool used to measure a value.

Practice!
| Practice 1.6.1 |
|---|
| How many significant figures are there in the measured quantity 0.0304 m? |
| (a) two significant figures |
| (b) three significant figures |
| (c) four significant figures |
| (d) five significant figures |
| Practice 1.6.2 |
|---|
| How many significant figures are there in the measured quantity 64.00 s? |
| (a) two significant figures |
| (b) three significant figures |
| (c) four significant figures |
| (d) five significant figures |
| Practice 1.6.3 |
|---|
| How many significant figures are there in the measured quantity 1.52 x 10³ kg? |
| (a) two significant figures |
| (b) three significant figures |
| (c) four significant figures |
| (d) five significant figures |
| Practice 1.6.4 |
|---|
| Round off 1059 °C to two significant figures. |
| (a) 1050 °C |
| (b) 1000 °C |
| (c) 1060 °C |
| (d) 1100 °C |
