Fluorescence and the Stokes Shift
Your Task Today
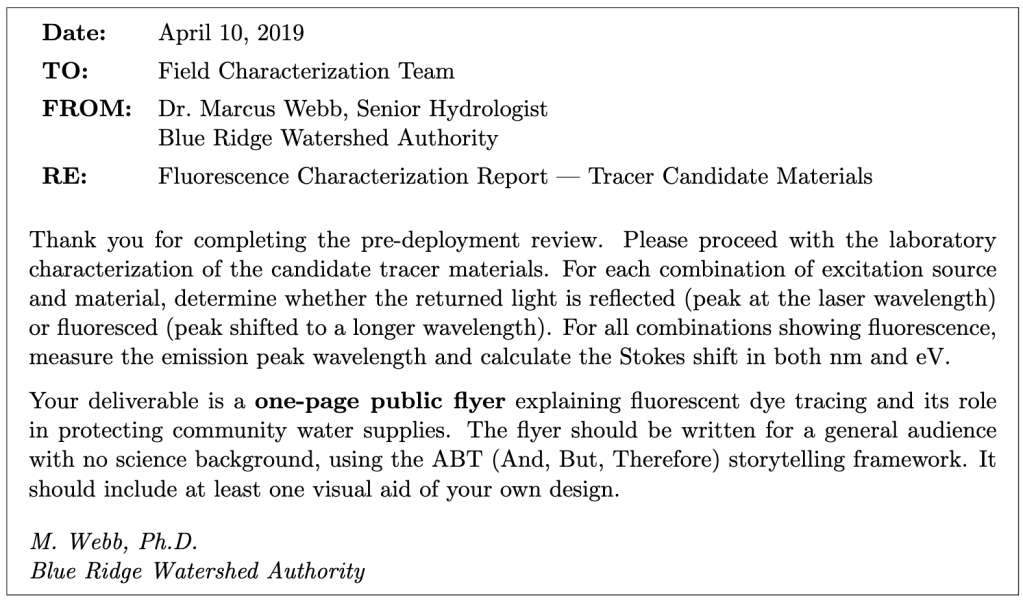
Section 1: Getting to Know the Apparatus
Equipment
- Vernier Red Tide spectrometer (USB, powered by computer)
- Fiber-optic cable (attached to spectrometer input)
- Vernier LoggerPro software
- Laser pointers: violet (λ ≈ 405 nm), green (λ ≈ 532 nm), red (λ ≈ 650 nm)
- Assorted colored sticky notes
The Red Tide spectrometer contains a diffraction grating and a linear CCD-array detector. The fiber-optic cable collects light from the sample surface and carries it to the grating, which disperses the light by wavelength. LoggerPro displays the result as intensity versus wavelength. You will use the cursor tool to identify peak wavelengths directly from the spectrum.
The fiber-optic probe should be held close to (but not touching) the surface of the sticky note, angled slightly so it collects light returning from the surface rather than the direct laser beam. The geometry matters: experiment with the probe position to get a clean signal.
Section 2: Setting Up the Spectrometer
- Connect the Red Tide spectrometer to the USB port. Open Vernier LoggerPro. From the Experiment menu, choose Change Units → Spectrometer → Intensity.
- To access spectrometer settings, choose Set Up Sensors → Spectrometer: 1. You may need to adjust the Integration Time for different laser/material combinations. Start with the default (32 ms) and adjust as needed.
- Before measuring any sticky notes, collect a reference spectrum of each laser alone: point the laser at a white piece of paper and hold the fiber probe nearby. Record the peak wavelength of each laser. These are your reference wavelengths for identifying whether a peak is reflected or fluoresced.
Laser safety. Never point a laser at anyone’s eyes. Do not shine the laser directly into the fiber-optic probe at close range — this can saturate or damage the detector. Always aim the laser at the sticky note surface, not at the probe tip.
Section 3: Surveying Reflection and Fluorescence
For each combination of laser and sticky note color, shine the laser onto the sticky note surface and position the fiber-optic probe to collect the returned light. Click Collect in LoggerPro and observe the spectrum. Identify the peak(s): is there a peak at (or very near) the laser wavelength, or is there a peak at a noticeably longer wavelength?
- Reflection: peak at (or within a few nm of) the laser wavelength
- Fluorescence: peak clearly shifted to a longer wavelength than the laser
- Both: you may see the laser line and a separate, broader emission peak
- Neither: the material absorbs the laser but does not fluoresce detectably
- For each combination, record what you observe. Write R (reflection), F (fluorescence), B (both), or N (neither/too faint to measure). If you observe fluorescence, record the emission peak wavelength λem. For each wavelength you measure, also measure the FWHM and record the uncertainty in the wavelength.
- Compare your results to the predictions you made in the pre-lab. Which combinations did you predict correctly? Where were you surprised? Explain any discrepancies in terms of the physics — do not just say the prediction was wrong.
Section 4: Quantitative Analysis — Stokes Shift
Choose at least two laser/material combinations from your survey that clearly show fluorescence (a shifted emission peak distinct from the laser line). For each, collect a careful spectrum and use the cursor tool to measure:
- The laser peak wavelength λlaser (from your reference measurement in Section 2)
- The fluorescence emission peak wavelength λem
- The FWHM of the emission peak (δλem) — this is your uncertainty in the emission wavelength
- For each of your two chosen combinations, calculate the following.
- Stokes shift in nm: ∆λ = λem − λlaser
- Energy of the excitation photon: Eex = hc/λlaser (in eV, using hc = 1240 eV · nm)
- Energy of the emitted photon: Eem = hc/λem (in eV)
- Stokes shift in eV: ∆E = Eex − Eem
- Fractional energy lost to heat: ∆E/Eex
- Uncertainty in ∆λ: propagate δλem (the FWHM of the emission peak) and δλex (the FWHM of the excitation peak)
Section 5: Exploring the Limits
- Try shining the red laser (λ ≈ 650 nm) on a sticky note that showed strong fluorescence under the violet or green laser. Describe what you observe. Is there fluorescence? If not, explain why in terms of photon energy and the fluorescence process.
- Look at the width of the fluorescence emission peak compared to the width of the laser line in your spectra. The laser line is very narrow; the fluorescence peak is much broader. What does this tell you about the energy levels involved in fluorescence compared to the sharp transitions in an atomic emission spectrum like hydrogen?
Section 6: Discussion
- In a real watershed tracing study, a hydrologist would need the fluorescence emission peak to be well separated from the excitation wavelength so that field detectors can distinguish the dye signal from scattered laser light. Based on your data, which of the laser/material combinations you tested would be most suitable as a field tracer, and why? Consider both the magnitude of the Stokes shift and the brightness of the emission.
- The fraction of absorbed photon energy lost to heat (∆E/Eex) represents energy deposited into the material during every fluorescence event. For a fluorescent dye deployed in a watershed at parts-per-trillion concentrations, is this heating effect physically significant? Justify your answer with an order-of-magnitude argument.
- You used sticky notes as a proxy for fluorescent dye materials. What are the limitations of this model system? Name at least two ways in which real fluorescent dye tracers in water would behave differently from sticky notes in air.
Section 7: Public Flyer
Working as a group, create a one-page public flyer about fluorescent dye tracing and what it reveals about water systems. The flyer should be designed for a general audience with no science background.
Required elements:
- A title
- An ABT (And, But, Therefore) narrative of 3–5 sentences that tells the story of fluorescent dye tracing and why it matters to communities
- The central scientific idea explained without jargon: that some materials absorb light of one color and re-emit it as a different color, and how that makes invisible things visible
- At least one visual aid of your own design (a diagram of the Stokes shift, a map showing a tracer pathway, or something else you find compelling)
- Fake event details (speaker name, date, time, location) that make the flyer look like a real public talk advertisement
What to avoid: equations; jargon without plain-language explanation; a bulleted list of facts instead of a narrative.
Learning Objective Alignment
Use this table when building your grade proposal to identify which parts of this assignment provide evidence for each learning objective.
| Section / Question | Learning Objectives |
|---|---|
| Section 1–2 (Apparatus, Setup) | 3, 6 |
| Section 3, Questions 1–2 | 1, 3 |
| Section 4, Question 3 | 1, 5, 6 |
| Section 5, Questions 4–5 | 1, 2 |
| Section 6, Questions 6–8 | 1, 2, 4 |
| Section 7 (Flyer) | 7, 8 |

