Introduction to the Oscilloscope
Before you begin: retrieve your pre-lab from D2L and compare your responses with your lab partners. In your shared lab notebook, record where your protocols agreed, where they differed, what you decided as a group, and whether any predictions changed after discussion. Then begin the experiment.
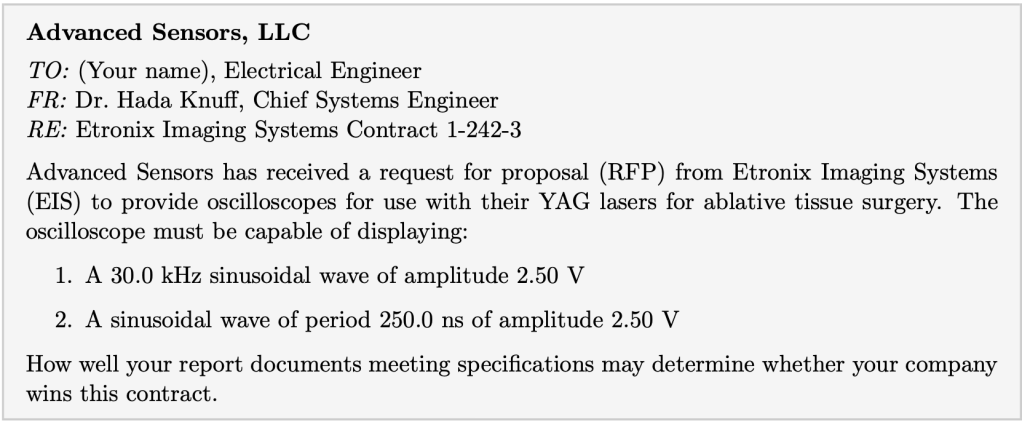
Before arriving at lab, read the following directive carefully:
Your Task Today
Advanced Sensors, LLC has been asked to demonstrate that its oscilloscopes can meet the signal display requirements of Etronix Imaging Systems. You are the engineering team responsible for making that demonstration. By the end of today’s lab session you will have:
- Set up and displayed both EIS signals using the oscilloscope and function generator
- Verified that your displayed signals meet the EIS specifications
- Saved representative waveform images for use in your report
- Documented your process and results in your shared lab notebook
Your lab notebook is your working record. Write down what you do, what you observe, what goes wrong, and how you fix it. A future engineer reading your notebook should be able to understand exactly what happened and why.
Section 1: Getting to Know Your Equipment
At your bench you will find a Tektronix TBS 1102B-EDU digital oscilloscope, a RIGOL DG1002 function generator, and coaxial cables with BNC connectors.
Before you start, take a few minutes to examine the equipment. Look at the front panel of the oscilloscope. You will see knobs and buttons organized into sections. Two sections will be most important for today:
VERTICAL — controls the voltage scale. The knob labeled SCALE under the VERTICAL section sets the volts per division on the screen. This is the vertical scale from your pre-lab calculations.
HORIZONTAL — controls the time scale. The knob labeled SCALE under the HORIZONTAL section sets the time per division on the screen. This is the timebase from your pre-lab calculations.
Look at the screen. When the oscilloscope is running with no signal connected, what do you see? Record your observation in your lab notebook.
- Locate the VERTICAL SCALE knob. Turn it and observe what changes on the screen. What does increasing the vertical scale do to a signal? What does decreasing it do?
- Locate the HORIZONTAL SCALE knob. Turn it and observe what changes. What does increasing the timebase do to a signal? What does decreasing it do?
- Find the input channels on the front panel. How many channels does this oscilloscope have? Which channel will you use for today’s experiment?
Section 2: Setting Up Signal 1 — 30.0 kHz, 2.50 V
You arrive at this point with a protocol your group agreed on. Use it. If something does not work as expected, reason through it before changing settings — ask yourself what the current settings should be producing, and compare that to what you actually see.
Connect the function generator to Channel 1 of the oscilloscope using a coaxial cable.
On the function generator:
- Set the function generator to produce a sinusoidal wave. Consult your pre-lab for the frequency and amplitude settings for Signal 1. Set them now.
- Make sure the output is turned on. On the RIGOL DG1002, press the button next to the output to activate it — the button lights up when the channel is on.
On the oscilloscope:
- Apply your predicted timebase and vertical scale settings from your pre-lab. What do you see on the screen? Does it match what you predicted?
- If the signal is not visible or not readable, work through the following questions before adjusting anything:
- Is the vertical scale appropriate for the amplitude of the signal? Could the signal be there but invisible because the scale is too large?
- Is the timebase appropriate for the period of the signal? Could many cycles be compressed into an unreadable blur, or could you be seeing only a fraction of one cycle?
- Is the function generator output actually on?
- Adjust one setting at a time and observe the effect before making another change.
- Once you have a stable, readable signal on screen, compare it to your predictions. Does the period look right? Does the amplitude look right? Record your observations.
Verifying the signal meets EIS specifications:
The EIS contract requires specific values — not approximately right, but documented to specification. You need to verify your signal numerically, not just visually.
Why this matters: A signal that looks right on screen may not actually meet the required specifications. Documenting numerical verification — not just a screenshot — is what separates a professional engineering report from a casual observation.
- Locate the MEASURE button on the front panel. Press it and explore the measurement options. Have the oscilloscope measure the frequency and amplitude of your signal automatically. Record the values it reports.
- You can also verify manually by counting divisions. Count the number of horizontal divisions occupied by one complete cycle and multiply by your timebase setting. Does this give you the expected period? Count the number of vertical divisions from the bottom to the top of the signal and multiply by your vertical scale setting. Does this give you the expected peak-to-peak voltage?
- Do your measured values meet the EIS specifications? If not, what would you adjust and why?
Saving your data:
- Insert a flash drive into the USB port on the lower front panel of the oscilloscope. On the menu, choose ACTION SAVE IMAGE and then SAVE IMAGE. Save a clear, representative image of Signal 1. You will need this for your report.
- In your lab notebook, record the oscilloscope settings you used — vertical scale, timebase, and any other settings that matter. A colleague reading your notebook should be able to reproduce exactly what you did.
Section 3: Setting Up Signal 2 — 250.0 ns period, 2.50 V
You have already worked through the setup process once. Apply what you learned from Signal 1 to Signal 2. Your group protocol should guide you, but you may find adjustments are needed.
- Update the function generator settings for Signal 2. Consult your pre-lab for the frequency and amplitude.
- Update your oscilloscope settings. What timebase do you need for this signal? How does it compare to Signal 1?
- Once you have a stable, readable signal, verify it meets the EIS specifications using both the automated measurement feature and manual division counting. Record all values.
- Save a representative image of Signal 2 to your flash drive.
- In your lab notebook, record all settings and observations as you did for Signal 1.
Section 4: Reflecting on the Experiment
Before you leave, take a few minutes to reflect on what happened today. These reflections go in your shared lab notebook and will be useful when you write your report.
- Compare your pre-lab predictions to what you actually observed. Where did your predicted settings work? Where did you need to adjust them? What caused the discrepancy?
- What sources of uncertainty affected your ability to precisely meet the EIS specifications? Were these instrumental, random, or systematic?
- Look back at your pre-lab protocol. Now that you have run the experiment, what would you change about it? What information did you not have before lab that would have been useful?
- The EIS contract requires that you document meeting specifications clearly enough that a client — not a physicist, but an engineer at Etronix — could read your report and be confident the oscilloscope does what they need. What information will you need to include in your report to make that case?
Learning Objective Alignment
Use this table when building your grade proposal to identify which parts of this assignment provide evidence for each learning objective.
| Section / Question | Learning Objectives |
|---|---|
| Section 1, Getting to know your equipment | 2, 5 |
| Section 2, Questions 4–8 | 3, 4 |
| Section 2, Questions 9–11 | 5, 6 |
| Section 2, Questions 12–13 | 7, 8, 9 |
| Section 3, Questions 14–18 | 3, 4, 5, 6, 7, 8, 9 |
| Section 4, Questions 19–21 | 2, 3, 4, 5 |
| Section 4, Question 22 | 7, 8 |

