Pre-Lab Assignment:
Fluorescence and the Stokes Shift
This assignment should take approximately 30–45 minutes to complete. You will do this work independently. When you arrive at lab, you will compare your responses with your lab partners and record the outcome of that discussion in your shared lab notebook before beginning the experiment.
Section 1: Context — Tracing Invisible Pathways in Water
In the summer of 1980, residents of a small town in Kentucky reported that their drinking water tasted and smelled wrong. The municipal well drew from a limestone aquifer, but no one knew exactly where the water in that aquifer came from, or whether surface contamination upstream could reach it. To find out, hydrologists poured a small amount of a fluorescent dye — rhodamine B, a bright pink powder — into a stream several miles away and waited. Ten days later, the dye appeared at the well.
Fluorescent dye tracing is now a standard tool in environmental science and public health. Hydrologists use it to map underground water flow, detect leaks in sewer systems, and locate the sources of contamination in watersheds. The technique works because fluorescent dyes absorb light at one wavelength and re-emit it at a longer, detectably different wavelength — a phenomenon called fluorescence. A field spectrometer can detect the dye at concentrations as low as a few parts per trillion, even in murky water, because the emission wavelength is distinct from anything naturally present in the environment.
The energy difference between the absorbed and emitted photon — the Stokes shift — is the key quantity that makes this detection possible. Before a dye can be deployed in the field, its fluorescence signature must be characterized in the laboratory: what wavelength excites it, what wavelength does it emit, and how large is the Stokes shift?
In this lab you will use laser pointers and a spectrometer to explore fluorescence in a set of everyday materials — sticky notes — and practice the same kind of spectral characterization that environmental scientists use before deploying a dye tracer.
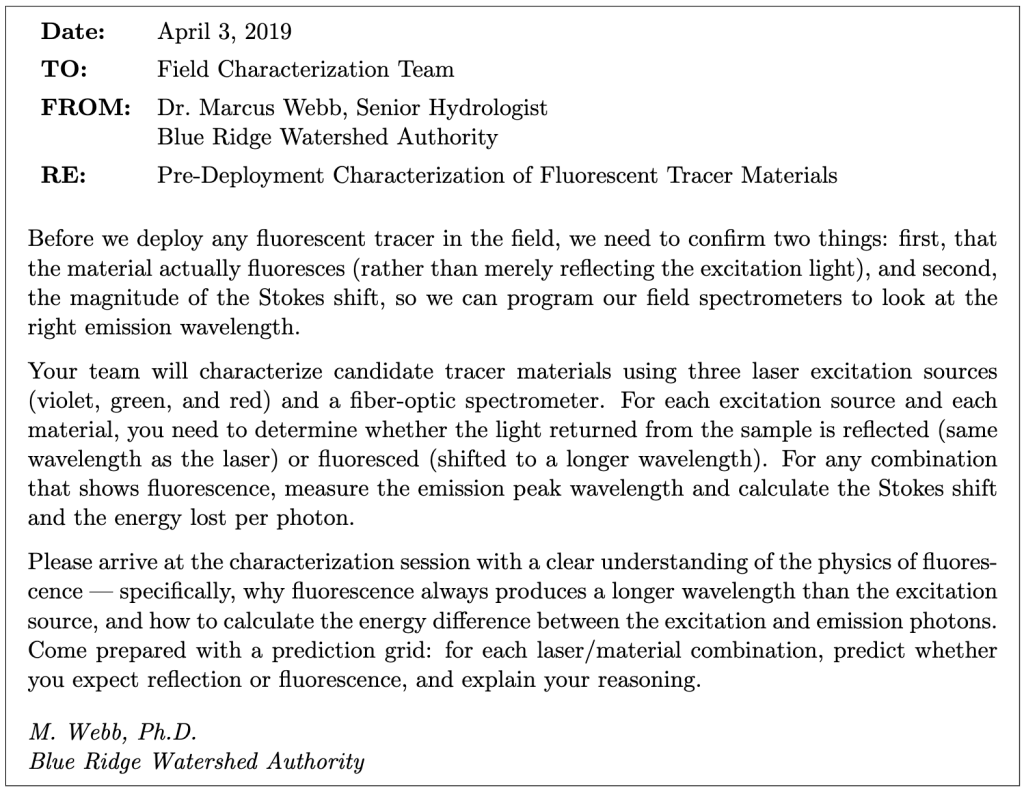
Before you begin the questions below, think about the story you want to tell in your public flyer. The connection between laboratory spectroscopy and protecting a community’s drinking water is a story about invisible things made visible. What angle will you take? You will return to this at the end of the pre-lab.
Section 2: Reflection vs. Fluorescence
When light strikes a material, several things can happen. In reflection, the photon scatters off the surface without being absorbed; the reflected light has the same wavelength (and therefore the same energy) as the incident light. In fluorescence, the photon is absorbed by a molecule, which is promoted to an excited electronic state. The molecule then loses a small amount of energy through internal vibrations (heat), and drops back down to the ground state by emitting a new photon. Because some energy was lost to heat, the emitted photon has less energy — and therefore a longer wavelength — than the absorbed photon.
This wavelength shift between excitation and emission is called the Stokes shift, named after the physicist George Gabriel Stokes, who first described fluorescence systematically in 1852.
- A fluorescent material is illuminated with green laser light (λex = 532 nm) and emits orange light (λem = 590 nm). Explain why the emitted photon must have lower energy than the absorbed photon. Use the relationship E = hc/λ to support your answer — do not just state it.
- Could a fluorescent material ever emit light at a shorter wavelength than the excitation source (i.e., could λem < λex)? Explain your reasoning in terms of energy conservation.
- In this lab you will use three laser pointers: violet (λ ≈ 405 nm), green (λ ≈ 532 nm), and red (λ ≈ 650 nm). Calculate the photon energy in eV for each laser using E = hc/λ with hc = 1240 eV · nm.
Section 3: The Stokes Shift
The Stokes shift is defined as the difference between the excitation wavelength and the emission wavelength:

It can also be expressed as an energy difference:

This energy is deposited into the material as heat (molecular vibrations) during the fluorescence process.
- Rhodamine B, a fluorescent dye used in watershed tracing, is excited at 532 nm and emits at approximately 590 nm. Calculate:
- The Stokes shift in nm (∆λStokes)
- The energy of the excitation photon in eV (Eex)
- The energy of the emitted photon in eV (Eem)
- The Stokes shift in eV (∆EStokes)
- The fraction of the absorbed photon’s energy lost to heat: ∆EStokes/Eex
- A second dye, fluorescein, is excited at 490 nm and emits at 514 nm. Without doing the full calculation, which dye has the larger fractional energy loss to heat —rhodamine B or fluorescein? Explain your reasoning qualitatively before checking with numbers.
Section 4: Predicting Reflection vs. Fluorescence
Not every combination of laser and material will produce fluorescence. Whether a material fluoresces depends on whether the excitation photon has enough energy to promote a molecule to an excited electronic state — and whether the material has the right molecular structure to do so. In general, materials with conjugated molecular structures (alternating single and double bonds, as in many dyes and fluorescent pigments) are good candidates for fluorescence.
For a material to fluoresce under a given laser:
- The excitation photon must have enough energy to excite the molecule.
- The emission must occur at a longer wavelength (lower energy) than the excitation.
- If the material simply absorbs the light and re-radiates at the same wavelength, that is reflection (or scattering), not fluorescence.
- In the lab you will shine each of the three lasers onto each of several colored sticky notes and observe the spectrum of the returned light. Before the lab, think about what you would expect to see in each case. For each combination below, predict whether you expect to see reflection (peak at the laser wavelength) or fluorescence (peak shifted to longer wavelength), and briefly justify your prediction.
| Laser | Sticky Note Color |
| Red (650 nm) | Red, Orange, Yellow, Green, Blue |
| Green (532 nm) | Red, Orange, Yellow, Green, Blue |
| Violet (405 nm) | Red, Orange, Yellow, Green, Blue |
- Based on your predictions, which laser do you expect to be most likely to produce fluorescence, and why? Which laser do you expect to be least likely?
Section 5: Instrument Preview
In this lab you will use the Vernier Red Tide spectrometer with Vernier LoggerPro software, the same instrument used in the hydrogen spectrum lab. The fiber-optic probe will be positioned close to the surface of the sticky note to collect the returned light.
- When you shine the green laser (λ = 532 nm) on a fluorescent material, you expect to see a peak at 532 nm (the laser line) and possibly a second, broader peak at a longer wavelength (fluorescence). Why would the fluorescence peak be broader than the laser line? What determines the width of each peak?
- Laser safety: The laser pointers used in this lab are Class IIIa (< 5 mW). You must never shine a laser pointer directly into anyone’s eyes or into the fiber-optic probe at close range. Explain in your own words why pointing the laser directly into the spectrometer fiber could damage the detector, even though the laser appears dim to the eye.
Section 6: Thinking About the Public Flyer
Your group’s final deliverable for this lab is a one-page public flyer about fluorescence and its role in environmental monitoring. The flyer should be written for a general audience with no science background, using the ABT (And, But, Therefore) storytelling framework.
- Draft a three-sentence ABT narrative for your flyer. Your narrative should be about fluorescent dye tracing and what it reveals about water systems — not about the lab itself.
- And: Set up the situation (what is the context? what do communities need to know about their water?).
- But: Introduce the complication (what is hidden or unknown? what is the problem?).
- Therefore: Deliver the resolution (how does fluorescence science help solve the problem?).
- What visual would best help a non-scientist understand the Stokes shift — the idea that absorbed light comes back out at a different color? Describe the visual you plan to include in your flyer (a diagram, a photograph, a sketch). You do not need to create it yet.
When you arrive at lab: compare your prediction grid (Question 6) with your lab partners before you begin. Where your predictions disagree, discuss the reasoning before collecting data — not after.
Learning Objective Alignment
Use this table when building your grade proposal to identify which parts of this assignment provide evidence for each learning objective.
| Section / Question | Learning Objectives |
|---|---|
| Section 1 (Context) | 1, 8 |
| Section 2, Questions 1–3 | 1, 2 |
| Section 3, Questions 4–5 | 1, 5 |
| Section 4, Questions 6–7 | 1, 2 |
| Section 5, Questions 8–9 | 3, 6 |
| Section 6, Questions 10–11 | 7, 8 |

