Pre-Lab Assignment: Introduction to the Oscilloscope
This assignment should take approximately 30–45 minutes to complete. You will do this work independently. When you arrive at lab, you will compare your responses with your lab partners and record the outcome of that discussion in your shared lab notebook before beginning the experiment.
Section 1: Professional Context
Before arriving at lab, read the following directive carefully:
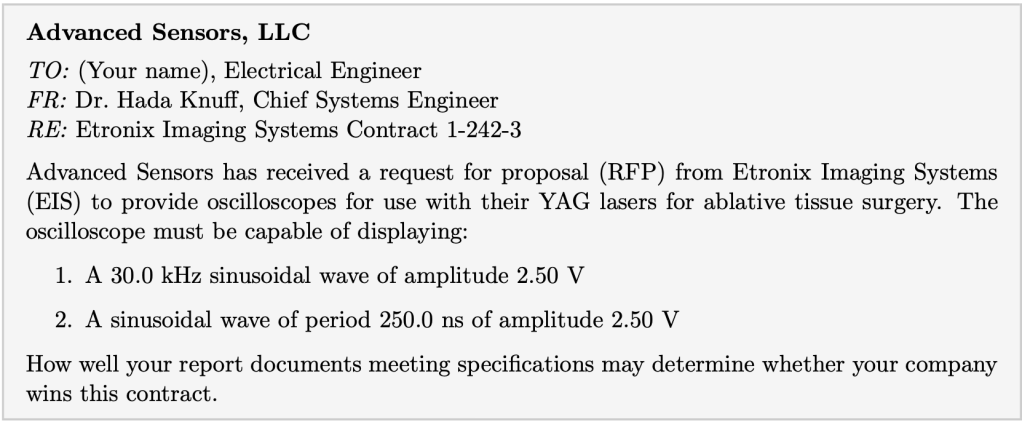
Answer the following questions:
- YAG lasers are used in ablative tissue surgery — a medical procedure where laser pulses are used to remove or reshape tissue with high precision. Why would the timing and amplitude of a laser pulse matter in this context? What could go wrong if the oscilloscope misrepresented the signal?
- You are acting as an electrical engineer responding to this contract. What does it mean to “meet specifications” in a professional engineering context? How is this different from simply getting a measurement that looks reasonable?
- The directive states that how well your report documents meeting specifications may determine whether your company wins this contract. What does this tell you about the role of clear, accurate communication in professional scientific and engineering work?
Section 2: Instrument and Measurement Preview
The instrument you will use is the Tektronix TBS 1102B-EDU digital oscilloscope. Look up its specifications.
- What is the bandwidth of the TBS 1102B-EDU? Record the value and its units.
- The bandwidth tells you the maximum frequency the oscilloscope can reliably measure. Convert the period of the second EIS signal (250.0 ns) to a frequency. Is this frequency within the bandwidth of the oscilloscope? Show your work.
- What is the maximum sampling rate of the TBS 1102B-EDU? The Nyquist-Shannon theorem states that a signal can only be accurately reconstructed if the sampling rate is at least twice the signal frequency. Does the oscilloscope’s sampling rate satisfy this requirement for both EIS signals? Show your work.
- What sources of uncertainty do you anticipate in reading amplitude and frequency from an oscilloscope display? Think about how the measurements are made and what limits your precision.
- Based on your research, what are the main limitations of this instrument that might prevent you from perfectly meeting the EIS specifications?
Section 3: Understanding the Oscilloscope and Planning Your Setup
An oscilloscope is an instrument that displays how a voltage changes over time. It plots voltage on the vertical axis and time on the horizontal axis — like a real-time graph of an electrical signal. Two settings control what you see on the screen:
Vertical scale — measured in volts per division. The screen has 8 vertical divisions. If you set the vertical scale to 1 V/div, the screen shows a total range of 8 V. If your signal has an amplitude larger than the screen range, it will be clipped — cut off at the top and bottom. If it is much smaller than the screen range, it will appear as a flat line near the center.
Timebase — measured in time per division. The screen has 10 horizontal divisions. If you set the timebase to 1 ms/div, the screen shows a total time window of 10 ms. If your timebase is too large, many cycles of your signal will be compressed together and unreadable. If it is too small, you may only see a fraction of one cycle.
The function generator produces the signal. You set the frequency and amplitude on the function generator, and the oscilloscope displays what it receives.
Why this matters: Choosing the right vertical scale and timebase is not just about making the signal look nice — it determines whether you can make accurate measurements from the display. A poorly chosen scale can make a signal appear to have a different amplitude or period than it actually does.
Now use these ideas to plan your setup for each EIS signal. Show all work and report answers with appropriate units.
Signal 1: 30.0 kHz sinusoidal wave, 2.50 V amplitude
- What will you set on the function generator for this signal? State the frequency and amplitude explicitly.
- Calculate the period of this signal. This tells you how much time one complete cycle takes.
- You want to display 2 complete cycles clearly on the screen. The screen has 10 horizontal divisions. What timebase setting (time per division) would achieve this?
- The signal has an amplitude of 2.50 V. Remember that amplitude is measured from the center to the peak — the total peak-to-peak voltage is twice the amplitude. The screen has 8 vertical divisions. What vertical scale setting (volts per division) would display the full signal without clipping, while keeping the signal large enough to read clearly?
- Based on your answers to questions 1–4, write a rough step-by-step plan for setting up this signal. Your partner should be able to follow your logic.
Signal 2: 250.0 ns period sinusoidal wave, 2.50 V amplitude
- What will you set on the function generator for this signal? You are given the period — calculate the frequency first, then state both.
- You want to display 2 complete cycles clearly on the screen. What timebase setting would achieve this?
- The amplitude is the same as Signal 1. What vertical scale setting would you use and why?
- Based on your answers to questions 6–8, write a rough step-by-step plan for setting up this signal.
Thinking Ahead
- How will you verify that your displayed signal actually meets the EIS specifications once you are in lab? What will you look for on the screen to confirm the frequency and amplitude are correct?
- The oscilloscope has a finite bandwidth — a maximum frequency it can reliably measure. Based on what you now know about both signals, do you anticipate any limitations in displaying either one? Why or why not?
- When you arrive at lab you may find your predicted settings need adjustment. What might cause that, and how would you decide what to change?
When you arrive at lab, compare your responses with your lab partners. In your shared lab notebook, record: where your protocols agreed, where they differed, what you decided as a group and why, and whether any of your predictions changed after discussion. Then begin the experiment.
Learning Objective Alignment
Use this table when building your grade proposal to identify which parts of this assignment provide evidence for each learning objective.
| Section / Question | Learning Objectives |
|---|---|
| Section 1, Questions 1–2 | 1, 2 |
| Section 1, Question 3 | 7, 8 |
| Section 2, Questions 1–3 | 2, 5 |
| Section 2, Questions 4–5 | 2 |
| Section 3, Questions 1–4 | 3, 5 |
| Section 3, Questions 5, 9 | 3 |
| Section 3, Questions 6–8 | 3, 5 |
| Section 3, Question 10 | 6 |
| Section 3, Questions 11–12 | 2, 4 |

