Pre-Lab Assignment:
Quantum Dots
This assignment should take approximately 30–45 minutes to complete. You will do this work independently. When you arrive at lab, you will compare your responses with your lab partners and record the outcome of that discussion in your shared lab notebook before beginning the experiment.
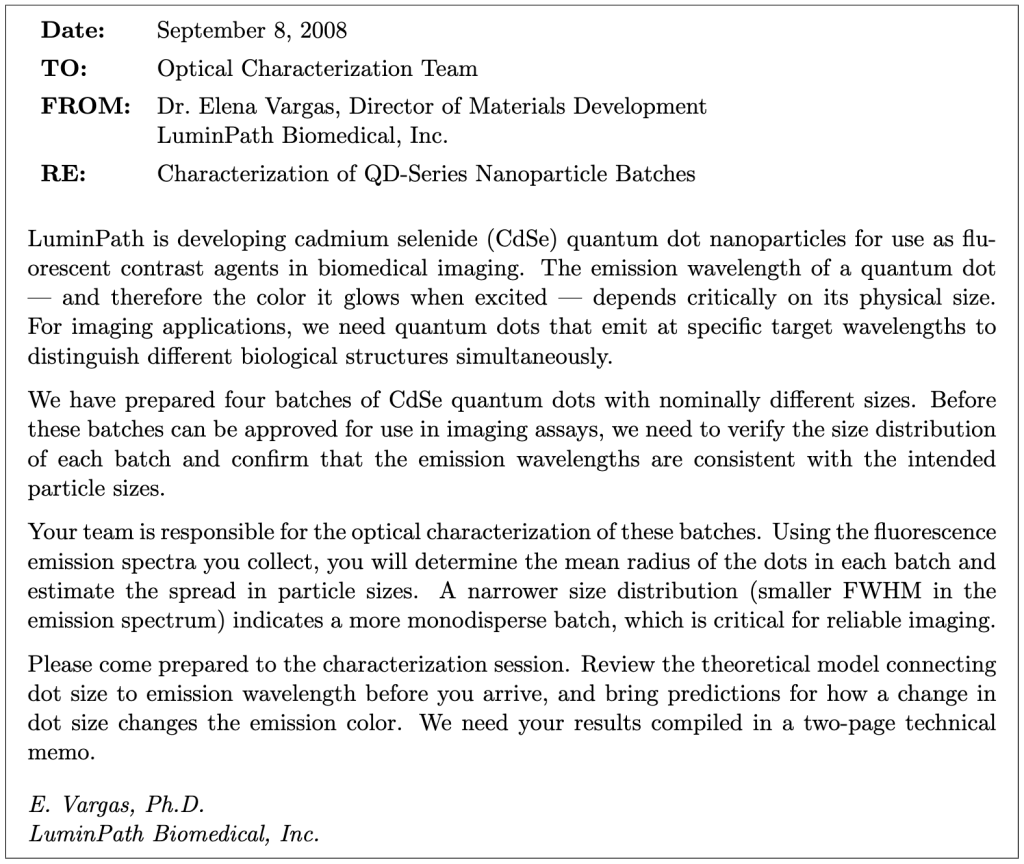
Section 1: Context — Sizing Nanoparticles for Medical Imaging
Section 2: Background — Semiconductors and Band Gaps
To understand how quantum dots work, you need a basic picture of the electronic structure of semiconductors.
In a solid material, quantum mechanics and the Pauli exclusion principle cause the discrete energy levels of individual atoms to merge into continuous energy bands. In a semiconductor, two bands are relevant: the valence band (the highest energy band that is fully occupied by electrons at low temperature) and the conduction band (the next higher band, which is empty at low temperature). The energy gap between them is called the band gap, Eg.
For bulk CdSe, the band gap is Eg = 2.15 × 10⁻¹⁹ J. At room temperature, an electron can be promoted from the valence band to the conduction band if it absorbs a photon with energy greater than Eg. When the electron falls back to the valence band (recombining with the hole it left behind), it emits a photon with energy approximately equal to Eg.
In a quantum dot, however, the particle is so small (2–10 nm) that quantum confinement effects become important. The electron and the hole left behind cannot behave as they would in a bulk solid; instead, they are confined to the tiny volume of the dot. This confinement raises the energy of both the electron and the hole above the bulk band edges — the smaller the dot, the greater the confinement energy, and the higher the energy (shorter the wavelength) of the emitted photon.
This is the quantum dot size–color relationship: smaller dots emit shorter wavelength (bluer) light; larger dots emit longer-wavelength (redder) light.
The combination of the excited electron and the hole it left behind is called an exciton. For a spherical quantum dot of radius R, the energy of the emitted photon is:

where:
- R is the radius of the quantum dot
- me* = 7.27 × 10⁻³² kg is the effective mass of the electron in CdSe
- mh* = 5.47 × 10⁻³¹ kg is the effective mass of the hole in CdSe
- Eg = 2.15 × 10⁻¹⁹ J is the band-gap energy of bulk CdSe
- h = 6.626 × 10⁻³⁴ J · s is Planck’s constant
Equation (1) is the three-dimensional particle-in-a-box result applied to an exciton. The first term is the kinetic energy of the lowest quantum state in a spherical 3D box, calculated separately for the electron and the hole. The “effective mass” captures the fact that electrons moving through a crystal lattice behave as if they have a different mass than free electrons. The hole is much heavier than the electron (compare mh* and me* above), which is analogous to a particle in a box being heavier and therefore having lower kinetic energy.
Section 3: The Size–Color Relationship
- Equation (1) predicts that the emitted photon energy ∆E increases as R decreases. Explain this physically in terms of quantum confinement: why does a smaller box lead to higher energy? You may connect to the 1D particle-in-a-box results from lecture.
- A batch of quantum dots emits yellow light (λ ≈ 580 nm) and a second batch emits green light (λ ≈ 520 nm). Which batch has the larger radius? Explain your reasoning — do not just cite the equation.
- As R → ∞ (dot radius becomes very large, approaching a bulk semiconductor), what does Equation (1) predict for the emitted wavelength λ? Show the limiting behavior mathematically and explain the physical meaning of the result.
Section 4: Predicting the Emission Wavelength
- Solve Equation (1) for the radius R in terms of the measured emission wavelength λ. Your result should be:

Show your algebraic steps.
- Define a combined effective mass parameter:

Calculate μ for CdSe using the values given above. Express your answer in kg. This parameter will simplify your lab calculations.
- Quantum dots used in biomedical imaging often emit in the 500–650 nm range. Using Equation (2), calculate the expected radius for emission at:
- λ = 520 nm (green)
- λ = 580 nm (yellow)
- λ = 620 nm (orange-red)
Show your work for one calculation explicitly.
Section 5: Uncertainty and Size Distribution
The emission peak of a quantum dot solution is not perfectly sharp — it has a finite width. In a real sample, the quantum dots are not all identical; there is a distribution of sizes. A dot that is slightly larger emits at a slightly longer wavelength, and a dot that is slightly smaller emits at a slightly shorter wavelength. The width of the emission peak therefore reflects the spread in particle sizes.
We quantify this width using the full width at half maximum (FWHM) of the emission peak. The FWHM in wavelength (δλ) can be propagated through Equation (2) to give the spread in radius (δR).
- Use the power rule to derive an expression for the uncertainty δR in terms of δλ, λ, and R. Start from Equation (2), which has the form
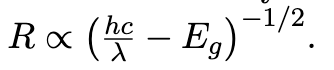
Let A = hc/λ − Eg. Then R ∝ A−1/2. Use the power rule: 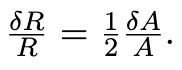 Then express δA in terms of δλ.
Section 6: Instrument Preview
In this lab you will use the Vernier Go Direct SpectroVis Plus spectrometer with an optical fiber accessory. The SpectroVis Plus connects via USB and is used with Vernier Spectral Analysis software (not LoggerPro). It measures fluorescence emission spectra in the range of approximately 380–950 nm.
The four quantum dot samples are contained in sealed vials. A violet LED excitation source illuminates each vial from below; the quantum dots absorb the violet light and re-emit at longer wavelengths. You will hold the fiber-optic probe alongside the vial to collect the emitted light.
- Why is a violet LED used as the excitation source rather than a red LED? Your answer should connect to the band gap of CdSe and the energy required to excite an electron into the conduction band.
- The SpectroVis Plus will show both the excitation light (violet) and the emission light from the quantum dots in the same spectrum. Explain how you will distinguish the excitation peak from the emission peak in your data. What wavelength do you expect for the excitation peak?
Check before submitting: your table from Question 6 should have predicted radii for three wavelengths; your uncertainty derivation (Question 7) should give δR as a function of δλ, λ, and R; and you should be able to explain in your own words why the excitation source must be violet.
Learning Objective Alignment
Use this table when building your grade proposal to identify which parts of this assignment provide evidence for each learning objective.
| Section / Question | Learning Objectives |
|---|---|
| Section 1 (Context) | 1, 8 |
| Section 2 (Background) | 1, 2 |
| Section 3, Questions 1–3 | 1, 2 |
| Section 4, Questions 4–6 | 1, 5 |
| Section 5, Question 7 | 5, 6 |
| Section 6, Questions 8–9 | 1, 3 |

