Quantum Dots
Your Task Today
Section 1: Getting to Know the Apparatus
Equipment
- Vernier Go Direct SpectroVis Plus spectrometer (USB)
- Optical fiber accessory (attached to SpectroVis Plus)
- Vernier Spectral Analysis software
- 4 sealed vials of CdSe quantum dot solutions (different sizes)
- Vial support rack
- Violet LED excitation source
The SpectroVis Plus measures fluorescence emission spectra from approximately 380 to 950 nm. A diffraction grating disperses the incoming light and a CCD array measures the intensity at each wavelength. Spectral Analysis displays the result as intensity versus wavelength. The optical fiber accessory carries emitted light from the sample to the spectrometer input.
The violet LED illuminates the bottom of each vial. The quantum dots in the solution absorb the violet photons and re-emit photons at longer wavelengths (fluorescence). You will position the fiber-optic probe alongside the vial to collect the emitted light. Both the excitation (violet) peak and the emission peak will appear in your spectrum; you will analyze only the emission peak.
Section 2: Setting Up the Spectrometer
- Connect the SpectroVis Plus to a USB port. Open Vernier Spectral Analysis software. The device should be detected automatically.
- Select Fluorescence mode in Spectral Analysis. This mode is optimized for emission measurements.
- Before measuring any samples, collect a reference spectrum of the violet LED alone (without any vial) so you can identify the excitation peak position. Record the peak wavelength of the excitation source.
- Position the vial rack so the violet LED illuminates the bottom of vial 1. Place the tip of the fiber-optic probe alongside the vial at the height of the liquid.
Safety. Do not remove the vials from the rack. The vials are sealed. Handle the rack carefully. If any vial appears cracked or leaking, notify your instructor immediately and do not attempt to clean it up yourself.
Section 3: Collecting Emission Spectra
For each vial, position the LED under the vial and the fiber probe alongside it, click Collect in Spectral Analysis, and adjust the integration time if needed so the emission peak is on scale (not saturated) and clearly visible above the baseline. Use the cursor tool to identify the emission peak. Do not confuse the emission peak with the excitation (violet) peak — the emission peak will be at a longer wavelength than the excitation source. Record the peak emission wavelength and the FWHM of the emission peak. Save the spectrum for each vial.
- Before measuring, describe what you observe visually when the violet LED illuminates each vial. List the approximate color of each vial’s emission. Does the order of colors match your prediction from the pre-lab?
Section 4: Calculating Dot Radius
Use the formula derived in your pre-lab to calculate the radius R of the quantum dots in each vial:

Constants for CdSe: Eg = 2.15 × 10⁻¹⁹ J; me* = 7.27 × 10⁻³² kg; mh* = 5.47 × 10⁻³¹ kg; h =
6.626 × 10⁻³⁴ J · s; c = 2.998 × 10⁸ m/s. Remember that λ must be in meters.
- Calculate R for all for vials.
Section 5: Uncertainty in Radius
From your pre-lab derivation, the uncertainty in radius due to the spread in emission wavelength is:

This uncertainty δR represents the spread in particle sizes within each vial — a physically meaningful quantity, not just experimental noise.
- Calculate δR for each vial using the FWHM (δλ) you measured. Show one complete calculation, then record all results.
Section 6: Graphical Analysis
- Plot emission wavelength λpeak (y-axis) versus dot radius R (x-axis) in Excel or equivalent. Include horizontal error bars using δR. Describe the trend of your graph in words: what is the relationship between dot size and emission wavelength? Is the relationship linear?
- From your graph or from Equation (1): as the dot radius increases without bound (R → ∞), what emission wavelength do you expect? Calculate this limiting wavelength numerically for CdSe. What physically happens to the quantum confinement energy in this limit?
Section 7: Estimating Atom Count
- The CdSe quantum dots consist of alternating Cd and Se atoms in a crystal lattice. The nearest-neighbor Cd–Se bond length in bulk CdSe is approximately 0.263 nm. Use this as an estimate for the effective size of one unit in the crystal. Estimate how many atoms wide each dot is (i.e., how many bond lengths fit across the diameter 2R). Express your answer for each vial. State clearly what simplifying assumption you are making.
Section 8: Discussion
- Which vial has the narrowest size distribution (smallest δR/R)? Would you recommend that vial for a narrow-band biomedical imaging application where a single, well-defined emission color is required? Justify your answer.
- In the pre-lab you calculated expected radii for emission wavelengths of 520 nm, 580 nm, and 620 nm. How do your measured radii compare to those predictions? Discuss any discrepancies.
- The SpectroVis Plus measures emission spectra. A different type of measurement — an absorption spectrum — would show you the range of photon energies the quantum dots absorb. Would you expect the absorption peak to be at the same wavelength as the emission peak, or shifted? Explain, using the concept of the band gap and any energy losses you might expect.
Section 9: Technical Memo
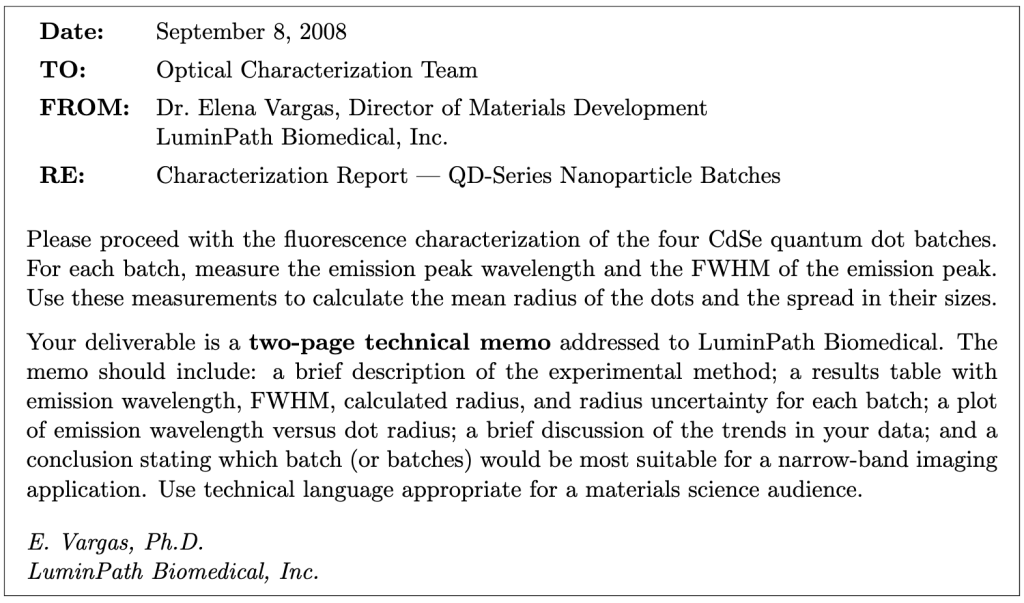
Working as a group, write a two-page technical memo addressed to Dr. Vargas at LuminPath Biomedical. The memo should be written for a materials science audience — use technical language, include equations where appropriate, and do not oversimplify. Two pages means two pages; be concise and precise.
Required sections:
- Introduction (2–3 sentences): state the purpose of the characterization, the material, and the intended application.
- Experimental Method (3–5 sentences): describe the instrument, the measurement procedure, and how you extracted peak wavelength and FWHM from the spectra.
- Theoretical Model (3–5 sentences + equation): state the quantum confinement model (Eq. 1) and the constants used. Define all symbols.
- Results (table + figure): present your results table (all four vials: λpeak, FWHM, R, δR) and your plot of λ vs. R with error bars.
- Discussion (one short paragraph): address the trend in your data, which batch has the narrowest size distribution, and what limits the monodispersity.
- Conclusion (2–3 sentences): state which batch(es) you recommend for narrow-band imaging and why.
Format: 11- or 12-point font, 1-inch margins, two pages maximum. The memo header (To/From/Date/Re) does not count toward the page limit. Your data table and figure may be embedded in the text or attached as a half-page appendix that does not count toward the two-page limit.
Learning Objective Alignment
Use this table when building your grade proposal to identify which parts of this assignment provide evidence for each learning objective.
| Section / Question | Learning Objectives |
|---|---|
| Section 1–2 (Apparatus, Setup) | 3, 6 |
| Section 3, Question 1 | 1, 3 |
| Section 3 (Data table) | 3, 5 |
| Section 4, Question 2 | 1, 5, 6 |
| Section 5, Question 3 | 5, 6 |
| Section 6, Questions 4–5 | 1, 5 |
| Section 7, Question 6 | 1, 4 |
| Section 8, Questions 7–9 | 1, 2, 5 |
| Section 9 (Memo) | 4, 7, 8 |

