The Photoelectric Effect
Your Task Today
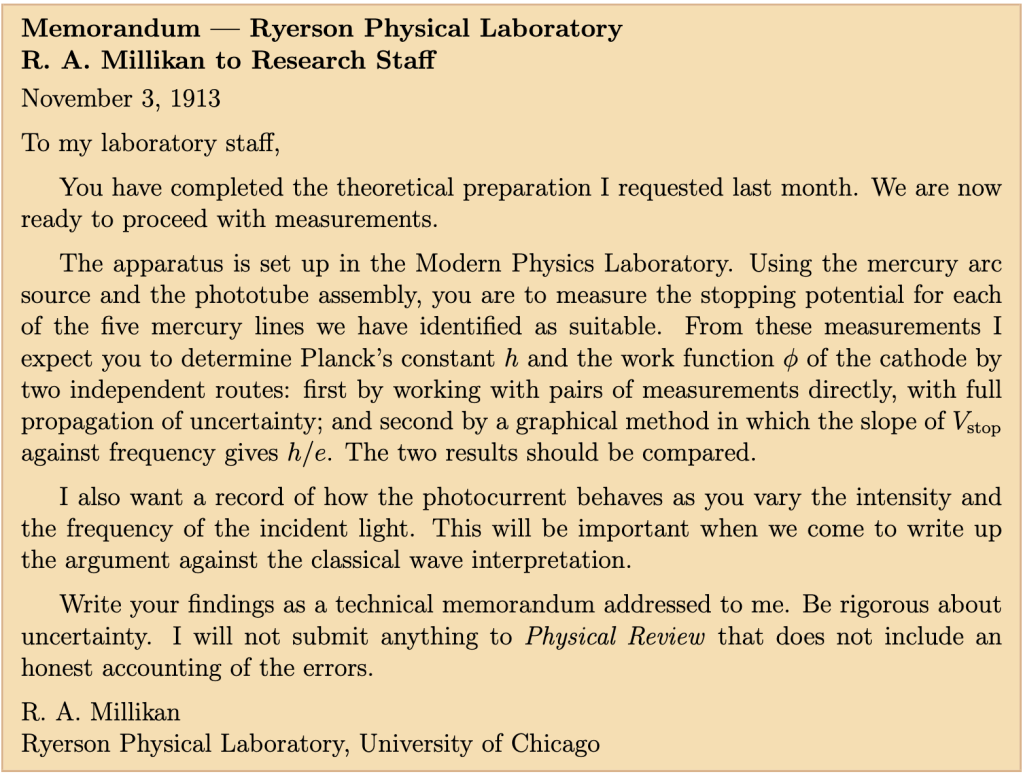
What this experiment is about. You will measure the stopping potential for five wavelengths of mercury light and use those measurements to determine Planck’s constant and the work function of the cathode metal. You will use two independent methods — individual trial calculations and a graphical fit — and compare them. You will also observe how photocurrent depends on light intensity and frequency. Your results will be reported as a technical memo.
Record everything in your shared lab notebook — what you do, what you observe, what surprises you, and how you reason through problems.
Section 1: Getting to Know the Apparatus
The BroLight model BEM-5006 photoelectric effect apparatus consists of a sealed vacuum phototube mounted in a light-tight enclosure. A mercury arc lamp (model BEM-5007) illuminates the phototube through a filter wheel and aperture.
Key controls:
- Filter wheel — selects one of five narrow-band interference filters (365, 405, 436, 546, or 577 nm). Rotate until the desired filter clicks into position.
- Aperture dial — selects the size of the opening through which light enters the phototube. This controls intensity without changing the spectrum.
- Current amplifier — measures the photocurrent (in the pA–nA range) between the phototube anode and cathode.
- Retarding voltage supply — applies a variable voltage across the phototube to oppose the flow of photoelectrons. The digital readout shows the applied voltage in volts.
- Zero/operate switch — in the ZERO position, the amplifier input is shorted for zeroing; in the OPERATE position, the phototube is connected.
Mercury lamp safety. The mercury arc lamp emits ultraviolet radiation. Do not look directly at the lamp or allow the beam to fall on unprotected skin. The lamp must warm up for at least 10 minutes before data collection; do this first.
Section 2: Warm-Up and Preparation
Step 1 — Turn on the mercury lamp
Turn on the mercury lamp now, before doing anything else. It requires a 10-minute warm-up to stabilize. While it warms up, complete Steps 2 and 3.
Step 2 — Compare pre-lab notes
As a group, compare your pre-lab derivations, predictions, and planned protocol. Resolve any discrepancies before you begin taking data.
- In your pre-lab you derived a measurement equation for Vstop. Discuss with your group members what physical quantity each term in that equation represents and where the energy carried by that term comes from or goes.
- Compare your predicted values of Vstop for each of the five wavelengths. If any member of your group got a noticeably different value, identify and resolve the discrepancy before proceeding.
Step 3 — Explain your protocol to an instructor
Before you take any data, one member of the group should be able to verbally explain to your lab instructor:
- What you will measure and why it gives you h and
 .
. - The order in which you will take measurements.
- How you will know when you have found the stopping potential.
- What you will do if a measurement looks wrong.
Section 3: Zeroing the Current Amplifier
Before connecting the phototube, you must zero the current amplifier.
- Block the light from the phototube (or keep the filter wheel between positions so no filter is aligned).
- Set the zero/operate switch to ZERO.
- Adjust the zero knob until the current readout displays 0.00.
- Switch to OPERATE.
Note. You may need to re-zero the amplifier if you change gain settings or if the reading drifts. Check the zero at the start of each new wavelength.
Section 4: Stopping Potential Measurements
Why this works. When light ejects electrons from the cathode, the electrons travel toward the anode. A retarding voltage opposes this motion. When the retarding voltage exactly cancels the maximum kinetic energy of the ejected electrons, even the fastest electrons cannot reach the anode and the current drops to zero. That voltage is the stopping potential Vstop.
For each of the five mercury wavelengths, you will:
- Select the appropriate filter.
- Set the retarding voltage to a value well below the expected stopping potential — start with the current clearly nonzero.
- Slowly increase the retarding voltage.
- Record Vstop as the voltage at which the current reaches zero (or your best estimate of zero given noise).
- How will you determine Vstop when the current does not drop cleanly to zero? Describe your criterion and be consistent across all five wavelengths.
- Record your stopping potential measurements in your lab notes.
- Calculate the frequency
 for each wavelength.
Section 5: Individual Trial Calculations
From your measurement equation for Vstop you can solve for h from any single measurement if you know . However, a better approach is to use two measurements: one at a high frequency and one at a low frequency, and solve for both h and simultaneously.
- Using your measurements at 365 nm and 577 nm (highest and lowest frequencies), set up a system of two equations and solve for h and .
- Repeat the calculation using your measurements at 405 nm and 546 nm.
- You now have two independent estimates of h and two of . Calculate the mean and standard deviation of each. Use the standard deviation as the uncertainty.
- Propagate the uncertainty in h using the power rule. Assume the uncertainty in each Vstop measurement is σV = 0.02 V (the precision of the voltage readout). The frequencies are calculated from the known wavelengths and carry negligible uncertainty.
- Report your best value of h with uncertainty from the individual trial method. Comment on whether your value is consistent with the accepted value.
Section 6: Graphical Analysis
The measurement equation for Vstop is a straight line with slope h/e and intercept –/e. A graph of Vstop vs. using all five data points will give a more reliable estimate of h than the pair-by-pair method.
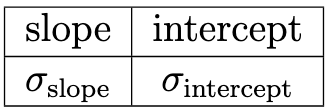
Using Excel’s LINEST function
LINEST performs a least-squares linear regression and returns the slope, intercept, and their standard errors. Enter your data in two columns ( values and mean Vstop values), then use:

This returns a 2 × 2 array. Enter it as an array formula.
- Construct a graph of
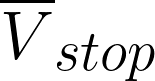 vs. in Excel. Add a trendline and display the equation and R2 value. Include the graph in your lab notebook.
 - Use LINEST to determine the slope m = h/e and its standard error σm. From these, calculate h and its uncertainty σh.
- From the intercept, determine the work function and its uncertainty.
- The R2 value measures how well the line fits the data (R2 = 1 is a perfect fit). What does your R2 value tell you about how well the photoelectric equation describes your data?
Section 7: Comparison of Methods
- Summarize your results for h, σh, and from both both methods.
- Do the two methods agree with each other within their respective uncertainties? Which method do you think is more reliable, and why?
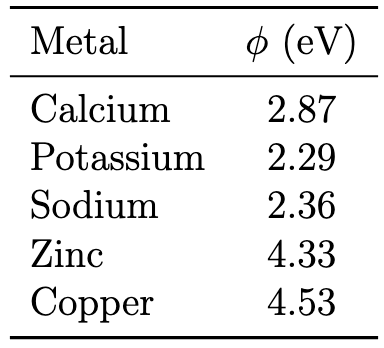
- Based on your measured work function , identify the most likely cathode metal. Use the reference values below.
Section 8: Current-Voltage Characteristics
So far you have measured only the stopping potential. Now you will observe how the shape of the current-voltage (I-V) curve changes with light intensity and with frequency.
Effect of intensity
- Select the 436 nm filter. Using the largest aperture, slowly scan the retarding voltage from a large negative value (forward bias, large current) through zero and up to the stopping potential. Sketch the I-V curve. Then switch to the smallest aperture (less intensity) and sketch the curve again on the same axes. Label each curve.
- How does changing the aperture (intensity) affect (a) the saturation current and (b) the stopping potential? Is this consistent with Einstein’s interpretation? Explain.
Effect of frequency
- Using the same aperture, sketch the I-V curves for the 365 nm and 546 nm filters on the same axes. Label each curve.
- How does changing the frequency affect (a) the saturation current and (b) the stopping potential? Explain the stopping potential result in terms of your measurement equation.
Section 9: Reflection on Uncertainty
- List at least three sources of uncertainty or systematic error in this experiment. For each, state whether it would cause your measured h to be too high, too low, or uncertain in direction.
- The warm-up period for the mercury lamp is important for measurement stability. How would you expect the stopping potential to change (if at all) during the warm-up period, and why?
Learning Objective Alignment
Use this table when building your grade proposal to identify which parts of this assignment provide evidence for each learning objective.
| Section / Question | Learning Objectives |
|---|---|
| Section 2, Questions 1–2 | 1, 2 |
| Section 4, Question 3 | 3, 5 |
| Section 5, Questions 4–9 | 3, 5, 6 |
| Section 6, Questions 10–13 | 3, 5, 6 |
| Section 7, Questions 14–16 | 3, 5, 6 |
| Section 8, Questions 17–20 | 1, 2, 3 |
| Section 9, Questions 21–22 | 6 |

